Global Waste Stats 2025: What the Numbers Reveal
Every year the world produces more trash than it can easily handle. In 2025, total solid waste crossed 2.5 billion tonnes, a rise of almost 200 million tonnes from the previous year. That growth isn’t random – it mirrors faster urbanisation, rising consumption and expanding e‑commerce. Understanding these figures helps manufacturers, policymakers and everyday people see where the pressure points are.
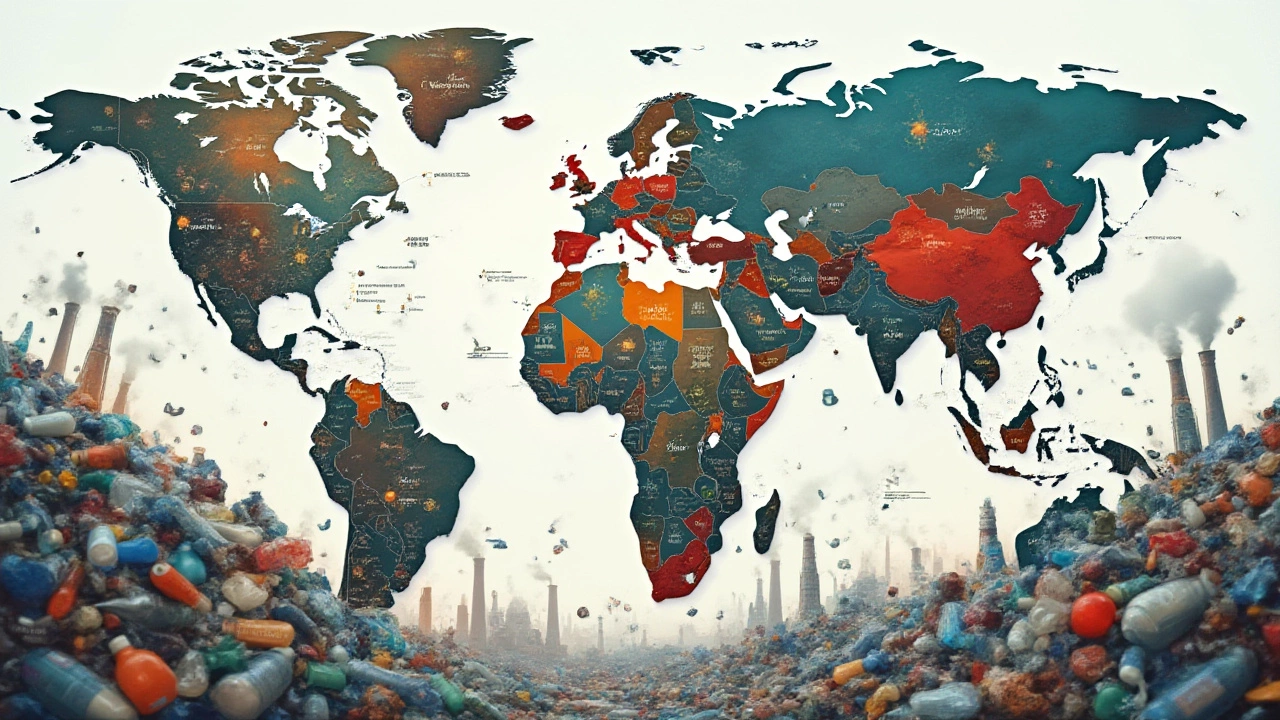
When you break the data down, a handful of regions dominate the waste picture. Asia‑Pacific alone accounts for roughly 60% of global waste, driven by China, India and Southeast Asian economies. North America and Europe together contribute about 25%, while Africa, Latin America and the Middle East share the remaining 15%.
Why Waste Numbers Matter
Numbers are more than just a tally. They show where regulatory focus should land and where businesses can improve material use. For instance, the average waste‑generation per capita in high‑income countries sits near 1.2 kg per day, compared with 0.5 kg in many low‑income areas. That gap signals both over‑consumption in affluent markets and the need for better collection systems in developing regions.
From a business angle, waste data drives decisions on packaging, product design and recycling investments. Companies that track the real cost of waste‑disposal can cut expenses and boost sustainability scores, which in turn appeals to investors and customers alike.
Top Waste Sources by Region
In Asia‑Pacific, the biggest waste stream is municipal solid waste (MSW) from rapidly growing cities, followed by construction and demolition debris. China’s construction sector alone adds over 300 million tonnes of waste each year. In Europe, food waste leads the pack, making up about 30% of total waste, while the EU’s strict recycling laws have pushed plastic waste down but not eliminated it.
North America still struggles with electronic waste (e‑waste). The United States generated roughly 50 million tonnes of e‑waste in 2025, and only about 35% of it was properly recycled. This presents a huge opportunity for manufacturers to design for easier disassembly and component reuse.
Africa’s waste profile is different. Open dumping remains common, but the continent shows rapid growth in informal recycling sectors. Small‑scale entrepreneurs are turning plastic bottles and metal scrap into income, highlighting how grassroots solutions can complement formal systems.
What does this all mean for you? If you run a manufacturing operation, look at your material flow – can you switch to recyclable packaging or use waste‑derived inputs? For consumers, simple steps like reducing single‑use plastics, composting food scraps and supporting products with recycled content make a measurable impact.
Governments worldwide are responding with targets. The United Nations aims to halve global waste generation by 2030, while several nations have pledged zero‑landfill policies for specific waste streams. Tracking progress against these goals requires up‑to‑date stats, which is why sites like Viraj Machinery keep a close eye on the numbers.
In short, global waste stats aren’t just figures on a spreadsheet. They’re a roadmap for smarter production, smarter consumption, and a cleaner planet. Keep an eye on the trends, act where you can, and watch the data shift in a positive direction.
Jul, 15 2025
Who Produces the Most Plastic Waste? Global Leaders and Shocking Stats
Discover which countries lead in plastic waste production, real numbers on global plastic pollution, industry impacts, and tips for reducing plastic waste.
Read More